Monitoring
You can monitor Siren Investigate using the following methods:
-
Using the Status API
-
Using the Health API
-
Enabling backend monitoring usint the APM Server
-
Enabling frontend monitoring using RUM plus APM Server
The rest of this section explain how to use APM Server to monitor.
Configuring and starting APM Server
Elastic APM is an application performance monitoring system built on top of the Elastic Stack https://www.elastic.co/docs/solutions/observability/apm
APM Server is a standalone binary. The server accepts messages from multiple clients and persists them in specified data stores. To monitor Investigate, we configure it to store messages coming from Investigate’s backend node processes and its frontend in Elasticsearch.
-
Download the APM Server version which corresponds to the Elasticsearch version used to store the monitoring data https://www.elastic.co/downloads/apm
-
Unzip it into
<AMP_SERVER_ROOT_FOLDER>.The minimum configuration required to support Investigate is in the
<AMP_SERVER_ROOT_FOLDER>/apm-server.ymlfile.apm-server: host: '127.0.0.1:8200' auth: secret_token: secret_token_123 # If RUM sends data directly to apm server from the browser we must enable anonymous access anonymous: enabled: true allow_agent: ['rum-js'] rum: enabled: true allow_origins: ['*'] allow_headers: ['Content-Encoding', 'Content-Type', 'Accept'] allow_methods: ['GET', 'POST', 'OPTIONS'] event_rate: limit: 300 lru_size: 1000 # Note: this must be set if we want to enable RUM through investigate proxy #response_headers: # Access-Control-Allow-Credentials: "true" output.elasticsearch: hosts: ["https://localhost:9220"] enabled: true username: "admin" password: "password" ssl.verification_mode: none workers: 4 bulk_max_size: 2048 queue: mem: events: 16384 flush.min_events: 2048 # send a batch once this many events are queued flush.timeout: 1s -
To start the server binary execute:
<AMP_SERVER_ROOT_FOLDER>/apm-server
Logs are stored, by default, under:
tail -f <AMP_SERVER_ROOT_FOLDER>/logs/apm-serverConfiguring backend process monitoring using APM Server
-
Modify the file in
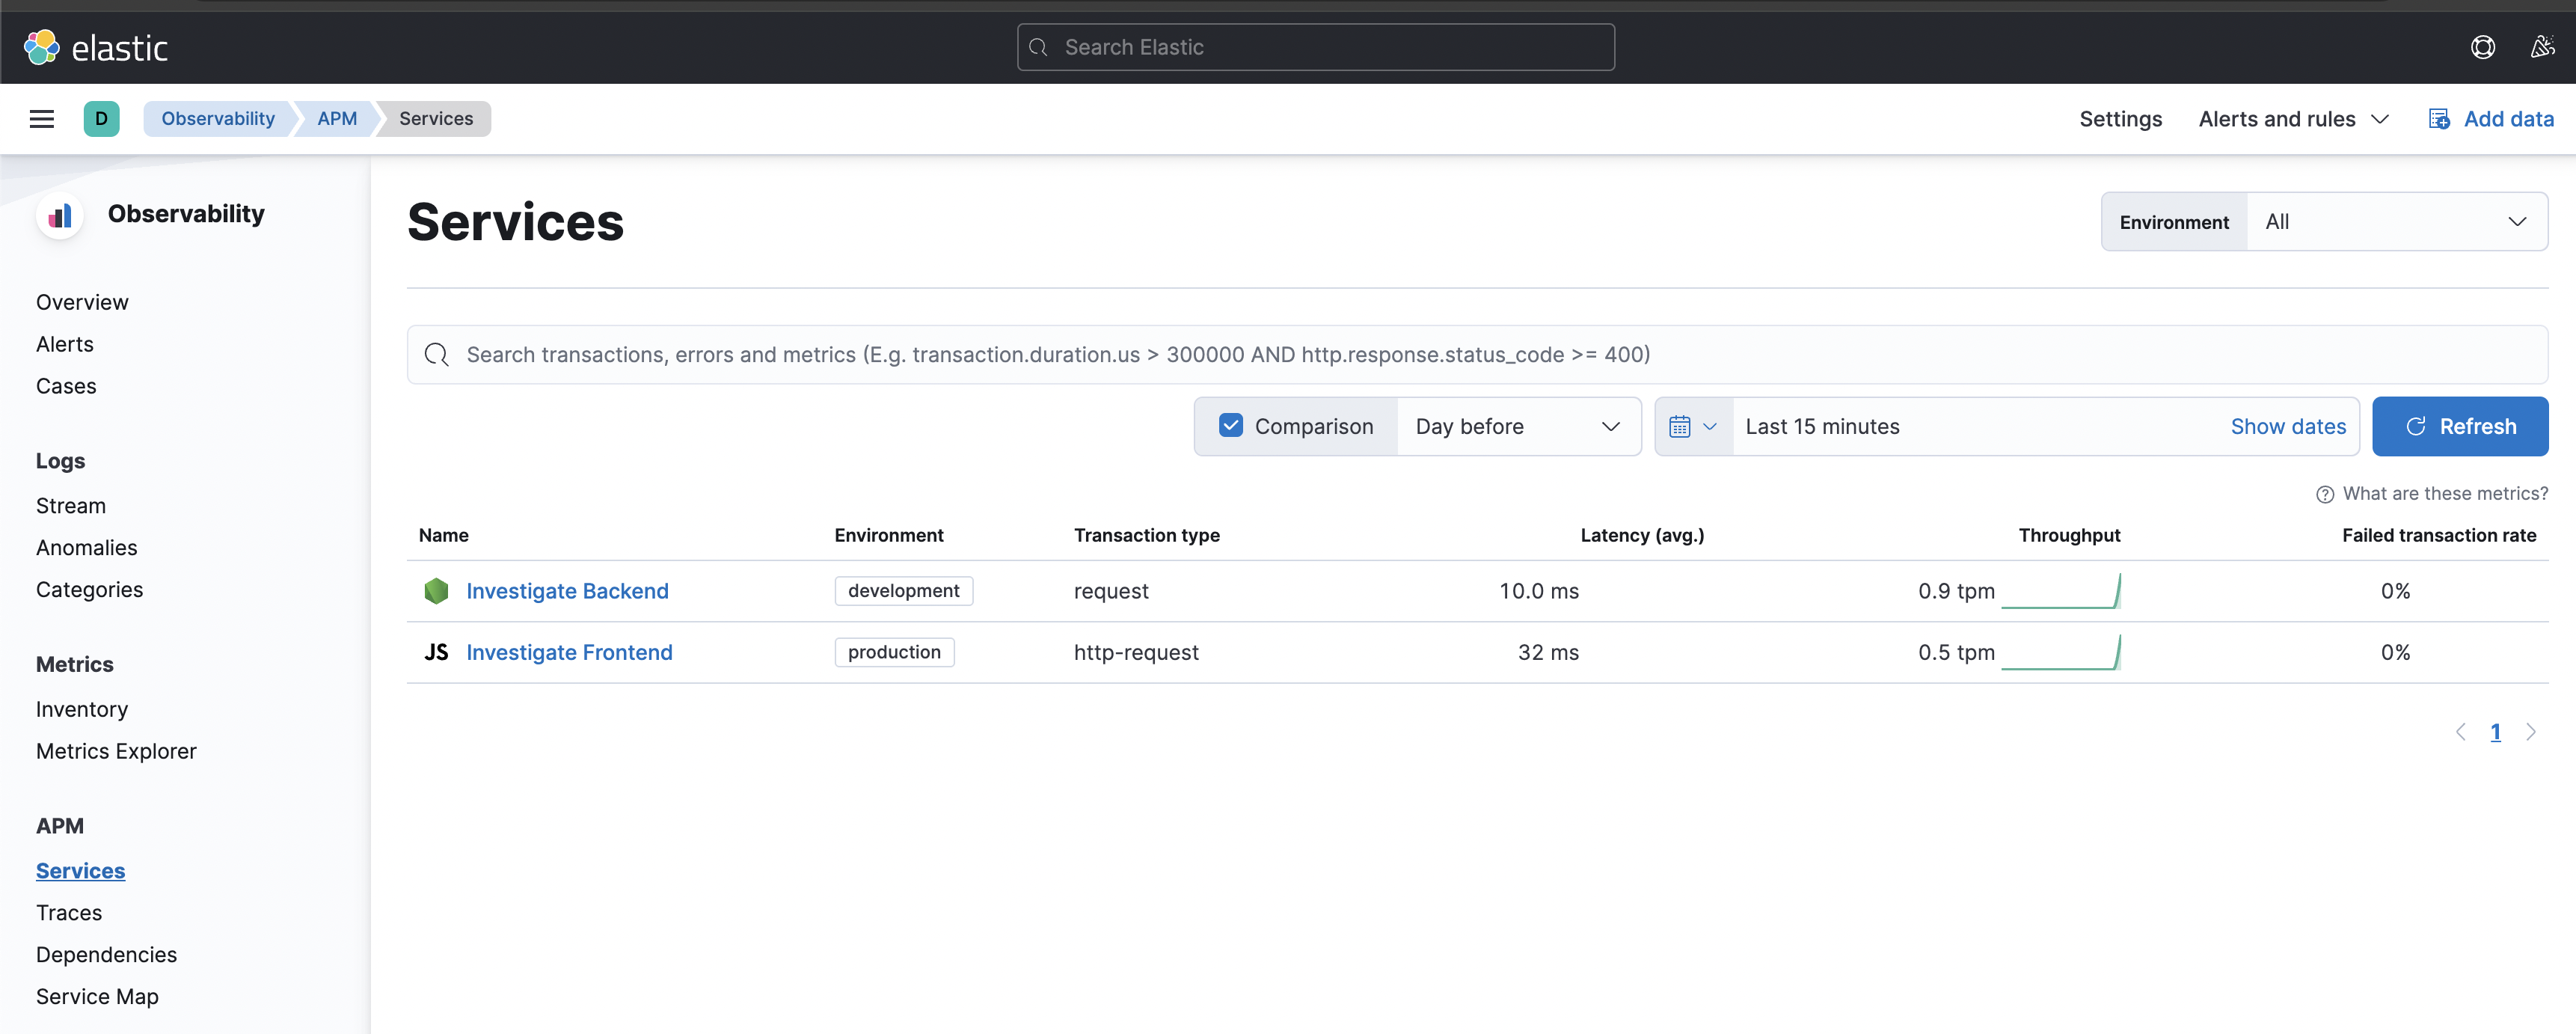
<INVESTIGATE_BASE_FOLDER>/config/investigate-apm-node.jsconst packageJson = require('../package.json'); module.exports = { serviceName: 'Investigate Backend', serviceNodeName: 'node1', secretToken: 'secret_token_123', serverUrl: 'http://127.0.0.1:8200', verifyServerCert: false, serviceVersion: packageJson.kibi_version, centralConfig: false }; -
Add the following snippet to the investigate.yml configuration to enable APM backend monitoring:
monitoring: apm: enabled: false serviceName: 'Investigate backend' environment: 'development' # Note: # the config file allow to specify all supported apm client configuration options #configFile: 'config/investigate-apm-node.js' # an absolute path if not provided a default will be used -
Start Investigate.
Configuring frontend monitoring using RUM module plus APM Server
Update the investigate.yml configuration to enable RUM frontend monitoring:
monitoring:
  rum:
    enabled: true
    serviceName: 'Investigate frontend'
    environment: 'development'
    # Note:
    # set serverUrl if you want the frontend to directly call the annonymous CORS enabled apm endpoint
    # if not set Investigate will proxy the event calls to the url configured in configFile
    serverUrl: 'http://localhost:8200'
    #configFile: 'config/investigate-apm-node.js' # an absolute path
If the APM server can not be configured to expose a URL which is CORS enabled and allow anonymous connections, you can configure the RUM module to send messages using an Investigate proxy.
To do this remove serverUrl from the above RUM monitoring configuration and uncomment the configFile property.